The theme: Feeding the Shared Future: A Call to Action.
Information and registration for the summit is here.
I’m speaking in the last afternoon session in conversation with Dan Giusti.
It’s at the DREAM Charter School,20 Bruckner Boulevard Website
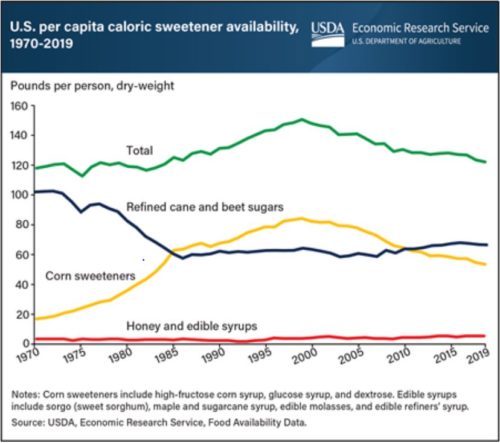
The USDA’s Economic Research Service, back on the job, has the latest statistics on the availability of sugars in the U.S. food supply.

Availability means the amount produced plus imports less exports, per year, per capita.
It is not the same as consumption (availability is likely to be higher), but it is an accurate indicator of trends.
The chart shows:
What does 120 pounds per capita per year mean?
Current Dietary Guidelines say sugars should not exceed 10% of daily calories. For diets of 2000 calories a day, that means no more than 50 grams of sugars (one gram of sugar = about 4 calories).
Therefore, the U.S. food supply provides at least three times the upper amount of sugars recommended.
Pretty much everyone would be healthier eating less sugar, if for no other reason than that they provide calories but minimal or no nutrients.
Their lack of nutritional value applies to sugars of all kinds, refined and unrefined, no matter their source: beets, cane, honey, sorghum, or maple trees.
The downward trend is in the right direction.